My 7 year old participated in a Science Fair with his cousin and his friend, they had a great time learning about how salt can change the freezing time of water. This was for an elementary school science fair, they presented at their booth then gave their presentation to all of the attendee’s. It was a chance to learn all with science and work on public speaking and presentation skills.
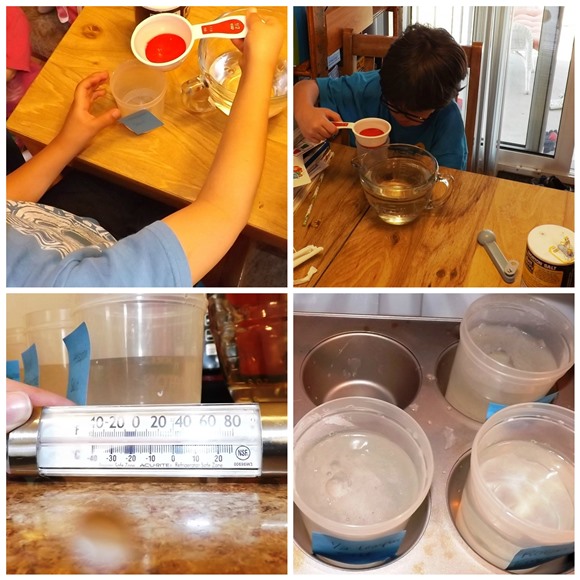 You will need an ordinary household freezer set on high Thermometer 4 identical freezer proof plastic containers capable of holding one cup of water Clock Paper Pen Marker Procedure Put the food etc. in the freezer in the fridge or in a cooler filled with ice. Clear all items from the freezer. You have to have an open uncluttered freezer in order to take accurate measurements of freezing rates. Fill each container with one cup of tepid room temperature tap water. Set one container of plain tap water aside. This will be the baseline for determining variances in freezing rates for the other containers. Label it “plain room temperature tap water.”
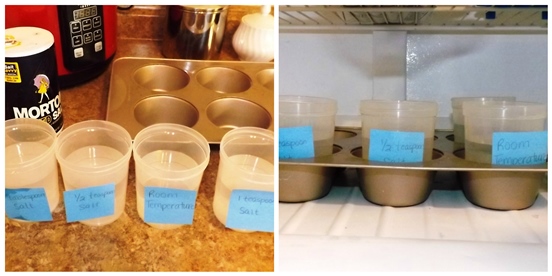
1) To the second container add 1/2 teaspoon of salt and stir well. Label it with “1/2 teaspoon/salt.”
2) To the third container add one tsp. of salt and stir well. Label as “one teaspoon/salt.”
3) To the fourth container add one tablespoon of salt and stir well. Label. Place the thermometer in the freezer and close the door. Wait one minute, then remove the thermometer from the freezer. Check the temperature shown on the thermometer and record it.
4) Don’t forget to have your children give their Hypothesis, their predictions on how salt will change the freezing time of water.
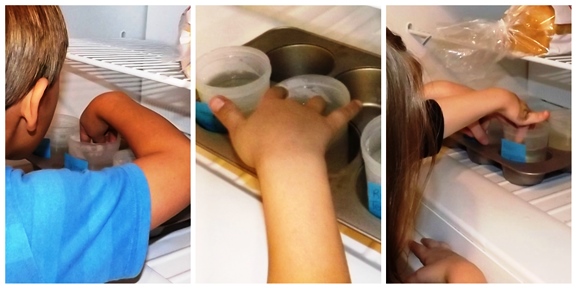
5) Next place all of the containers in the freezer at the same time. Record the time on the clock. At hourly intervals check the water samples you have put in the freezer. Do this quickly using your index finger so as not to affect the internal temp of the freezer. Make sure that every time you perform a check that you close the freezer door firmly. You must do this to maintain a constant temp in the freezer. Record the time at which each sample was frozen “solid” or did not freeze at all after 8 hours.
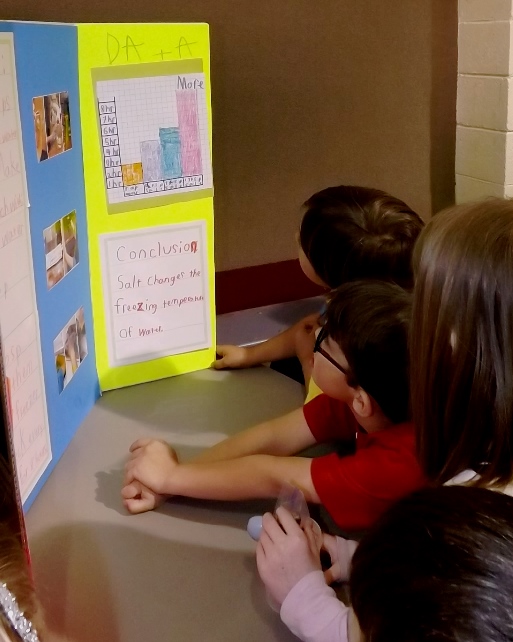
Data and Charts Record all the procedures and experiments you conducted and the data you got from each here. Make it clear and understandable. We had the kids make a tri-fold presentation board. On it they recorded their scientific information like Question/Problem, Hypothesis, Materials, Procedure, Data, and Conclusion. They hand wrote everything and made a bar graph by hand. They also pasted some pictures of the experiment.
The kids enjoyed every step of the process, even sharing the results with the classmates. I highly recommend this experiment for your Elementary children, it was a fun learning experiment.
Leave a Reply